Written by: Nimesh Chakravarthi, Co-founder & CTO, Struct
Key Takeaways
- Manual log hunting at 3 a.m. wastes up to 45 minutes per incident gathering context across siloed tools before any fix begins.
- Structured JSON logging, trace ID propagation, and log-based runbooks directly attack the most expensive phase of MTTR: context gathering.
- An 8-item checklist covers standardized log levels, centralized observability, sensitive data masking, and post-incident schema reviews.
- Enriched logs with deployment metadata and alerts tied to explicit runbooks remove the “what do I do now?” pause during incidents.
- Automate your on-call runbook with Struct to turn clean logs into zero-click root cause analysis and faster incident resolution.
8-Item Incident-Response Logging Checklist
The following table shows how each practice removes a specific bottleneck in triage, with time spent before and after adoption.
| # | Practice | Triage Time Before | Triage Time After |
|---|---|---|---|
| 1 | Structured JSON logging with high-value fields | ~15 min parsing | ~2 min search |
| 2 | Standardized log levels and event taxonomy | ~8 min noise filtering | ~1 min severity scan |
| 3 | Consistent trace ID propagation | ~10 min correlation | ~1 min trace lookup |
| 4 | Centralized logs + metrics + traces | ~12 min tool-switching | ~2 min single pane |
| 5 | Deployment and code context enrichment | ~5 min commit hunting | ~30 sec field read |
| 6 | Log-based alerts tied to runbooks | ~10 min “what now?” | ~1 min runbook follow |
| 7 | Sensitive data masking at emit time | Compliance review delay | Zero delay |
| 8 | Post-incident logging retrospectives | Recurring blind spots | Continuous schema improvement |
1. Use Structured JSON Logging with Only High-Value Fields
Goal: Make every log line machine-queryable and human-readable without parsing gymnastics. Owner: Individual contributor (IC).
Emit only fields that answer who, what, when, where, and how severe. A standard event looks like this:
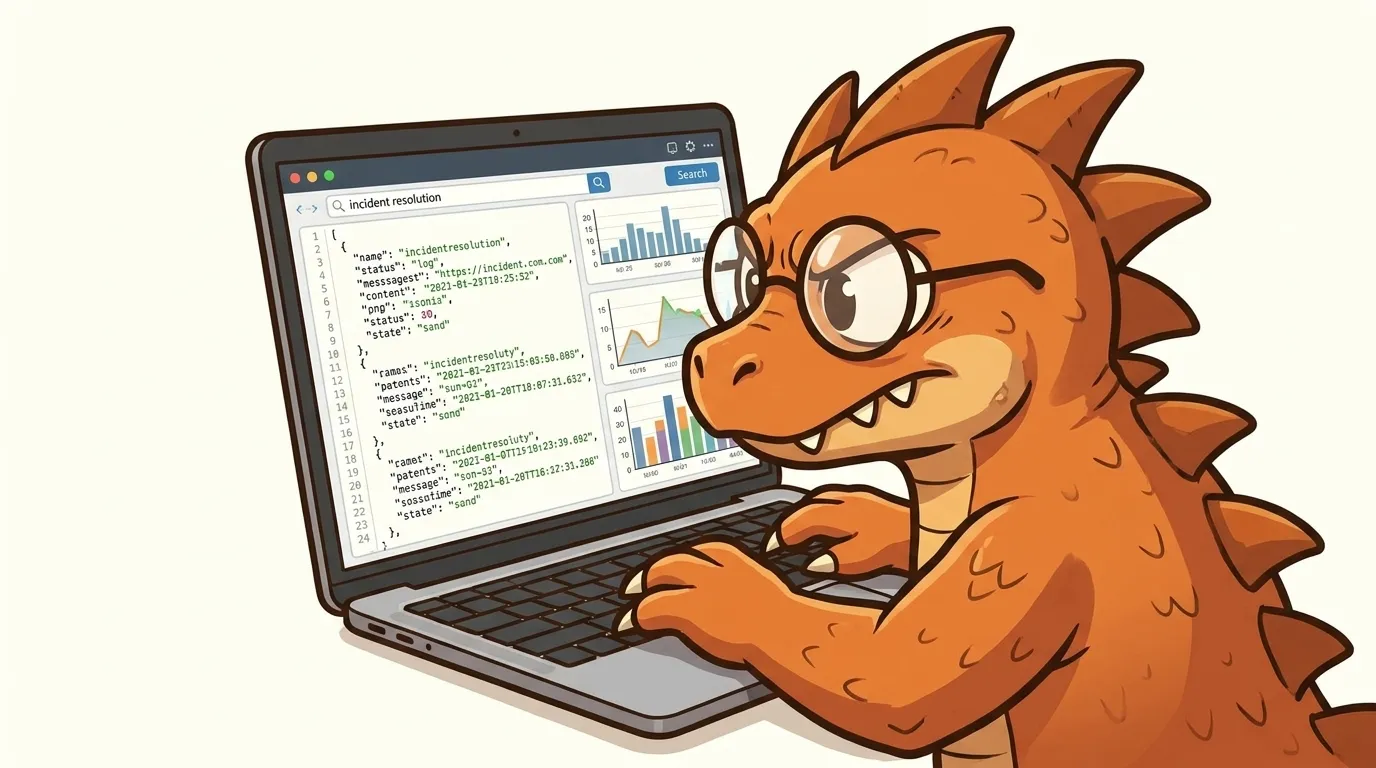
{ "timestamp": "2026-06-17T03:07:42.311Z", "level": "error", "service": "payments-api", "trace_id": "4bf92f3577b34da6", "span_id": "00f067aa0ba902b7", "user_id": "usr_REDACTED", "event": "charge.failed", "error_code": "insufficient_funds", "latency_ms": 312, "region": "us-east-1" }Parsing and structuring logs into a unified format via indexing and tagging enables near-instant search and filtering, accelerating incident triage and root-cause analysis. The trade-off is upfront schema discipline, and the payoff is no more regex archaeology at 3 a.m.
2. Standardize Log Levels and Event Taxonomy Across Services
Goal: Ensure every service speaks the same severity language so alert routing stays deterministic. Owner: SRE.
Adopt five levels, debug, info, warn, error, critical, and enforce them through a shared logging library. Configuring all alerts to include standardized severity levels from info to critical enables engineers to prioritize work, reduce time on low-value alerts, and improve MTTR. Implementing advanced filtering and establishing baselines for normal versus abnormal behavior can reduce alert volume. The same principle applies to application logs: fewer, well-classified events beat a firehose of undifferentiated output.
3. Propagate and Log Trace IDs from Request Start to Finish
Goal: Reconstruct a complete request timeline across every microservice without manual correlation. Owner: IC.
How to correlate logs with traces
Generate a trace_id at the API gateway or load balancer on every inbound request. Pass it as an HTTP header (X-Trace-ID or W3C traceparent) and inject it into every downstream log event and span. A minimal middleware pattern in Node.js:
app.use((req, res, next) => { req.traceId = req.headers['x-trace-id'] || crypto.randomUUID(); res.setHeader('x-trace-id', req.traceId); logger.setContext({ trace_id: req.traceId }); next(); });Automatically linking traces to logs in one interface reduces effort and speeds up fault resolution by enabling engineers to reach root cause faster without switching between multiple observability tools. The trade-off is a small header-propagation overhead, and the gain is turning a 10-minute correlation exercise into a single query.
4. Centralize Logs, Metrics, and Traces in One Platform
Goal: Remove tool-switching during triage. Owner: SRE.
The table below highlights the shift from fragmented tools to a single interface that collapses context gathering into one workflow.
| Signal | Siloed (Before) | Centralized (After) |
|---|---|---|
| Logs | CloudWatch, Sentry, GCP | Single query interface |
| Metrics | Datadog, Grafana | Co-located with logs |
| Traces | Separate APM tab | Linked via trace_id |
| Avg. context-gather time | ~12 min | ~2 min |
Centralizing logs from servers, applications, firewalls, and cloud services in a single platform eliminates manual access to individual devices and reduces troubleshooting time during incidents. AI agents continuously parsing logs, metrics, traces, and change events to correlate related alerts can reduce MTTR.
5. Enrich Logs with Deployment and Code Context at Build Time
Goal: Reveal the commit, version, and environment behind a regression without a GitHub archaeology session. Owner: IC and engineering manager.
Fields to log during deployments
Inject build metadata as structured fields during CI/CD:
{ "event": "deployment.complete", "service": "checkout-service", "version": "v2.14.3", "git_sha": "a3f8c21", "deployed_by": "ci-bot", "environment": "production", "timestamp": "2026-06-17T02:55:00Z" }When an error log carries git_sha and version, the on-call engineer immediately sees whether the incident correlates with a recent deploy without leaving the log viewer.
6. Build Log-Based Alerts and Attach Explicit Runbooks
Goal: Remove the “what do I do now?” delay by pairing every alert with a pre-written response procedure. Owner: SRE.
The examples below show how to connect common log patterns to concrete first steps and escalation paths so every alert becomes an actionable play.
| Alert Pattern | Runbook Step 1 | Runbook Step 2 | Escalation Path |
|---|---|---|---|
error_code: db_timeout > 5/min |
Check RDS CPU + connections | Review slow query log | DBA on-call |
event: charge.failed spike |
Verify payment gateway status | Check recent deploy SHA | Payments team lead |
level: critical in auth-service |
Confirm blast radius in Struct | Rotate suspect credentials | Security lead |
Automated alerts set up for critical events enable swift response and reduce the time between detection and action. Effective filtering of alerts and events can reduce raw event volume by 60–80% without losing actionable information.
7. Mask or Tokenize Sensitive Data While Keeping Logs Useful
Goal: Maintain investigative fidelity without logging PII, PAN, or PHI. Owner: IC.
Apply redaction at the logger level, not as a post-processing step:
{ "user_id": "usr_REDACTED_a3f8", "card_last4": "4242", "email": "***@***.com", "event": "payment.attempted" }Tokenized user identifiers preserve the ability to count affected users and correlate sessions without exposing raw PII. The trade-off is some loss of forensic depth, and the gain is SOC 2 and HIPAA compliance without slowing down triage.
8. Run Post-Incident Logging Retrospectives to Evolve Schemas
Goal: Turn every incident into a schema improvement that shortens the next one. Owner: Engineering manager.
Use this quarterly logging retrospective checklist:
- Which alerts lacked enough log context to diagnose without escalation?
- Which fields were queried most during the last five incidents?
- Are any services still emitting unstructured strings?
- Have new services adopted the shared logging library?
- Did any log-based runbooks fail to match the actual alert pattern?
Once your logging infrastructure delivers clean, correlated, enriched signals, you can layer AI-driven investigation on top to remove the human bottleneck in first-pass triage. The next section explains how platforms like Struct consume the structured logs produced by practices 1–8 and convert them into zero-click root cause analysis.
Integrating Log Management with AI-Driven Investigation Platforms
The eight practices above produce clean, correlated, enriched logs. The next step is removing the human from the first-pass investigation entirely. Customers working at large scale with many services report an 80% reduction in triage time, with the platform delivering root cause before an engineer even opens their laptop.
When Struct receives an alert from Slack or PagerDuty, it queries your connected observability stack such as Datadog, CloudWatch, Sentry, GCP Logs, or Azure Traces. It correlates trace IDs across services, maps a unified timeline, and surfaces a root cause with suggested fixes in a dynamically generated dashboard. Companies like FERMAT and Arcana rely on this workflow to investigate thousands of alerts monthly at the speed described above. The well-structured logs produced by practices 1–8 are the fuel, and Struct is the engine that converts them into zero-click root cause analysis.
See how Struct investigates alerts automatically
The capabilities above describe what Struct does when an alert fires. The following section walks through how that investigation fits into your team’s daily incident response workflow, from alert to resolution to handoff.
How Log Management Best Practices Fit Daily Engineering Operations
In practice, the workflow looks like this. An alert fires in a designated Slack channel. Struct auto-investigates and posts a blast-radius summary before the on-call engineer acknowledges. The engineer reviews the Struct dashboard, confirms the root cause, and follows the linked runbook.
The incident commander coordinates in the same thread. Once resolved, Struct hands off context to GitHub for a PR or to a coding agent for an automated fix. Newer engineers can handle on-call shifts confidently because Struct provides the tribal knowledge that previously lived only in senior engineers’ heads.
Measuring Impact and Continuous Improvement
Track the following four metrics quarterly to quantify the impact of better log hygiene and AI-driven investigation on your operations.
| Metric | Baseline (Before) | Target (After) |
|---|---|---|
| Triage time per incident | 30–45 min | <5 min |
| MTTR | 60–90 min | <20 min |
| False-positive escalations | High (noise-driven) | Low (filtered) |
| On-call burden (hrs/week) | 8–12 hrs senior eng. | 1–2 hrs review only |
Track these metrics quarterly alongside schema retrospectives. The filtering and correlation practices described earlier compound over time, driving continuous MTTR improvement. For Series A–C teams, every hour reclaimed from triage is an hour returned to product velocity.
Common Pitfalls and How to Avoid Them
The following five pitfalls show the most common ways teams undermine their own logging setup. The first two damage signal quality at the source, the next two break the handoff from investigation to action, and the last one blocks continuous improvement.
- Logging everything at DEBUG in production. Prioritizing telemetry quality and relevance over sheer data volume reduces alert noise from low-value logs. Set production log levels to
infoand above by default. - Inconsistent trace ID formats across services. Without a shared propagation standard such as W3C traceparent, cross-service correlation breaks silently. Enforce the standard through a shared middleware library.
- Alerts without runbooks. An alert that fires without a linked procedure forces engineers to improvise under pressure. Every alert definition should reference a runbook entry.
- Logging PII in plaintext. Redact at emit time, not post-hoc. Post-processing redaction pipelines introduce latency and new failure modes.
- Skipping post-incident schema reviews. Without effective filtering and correlation, up to 95% of alerts in some environments were effectively noise, conditioning engineers to ignore notifications. Retrospectives prevent schema debt from accumulating.
Conclusion: From Manual Triage to Zero-Click Investigation
The path from manual triage to under five minutes of investigation time follows a staged rollout. Start with structured JSON logging and trace ID propagation in practices 1 and 3. Centralize signals in practice 4. Then add enrichment, runbooks, masking, and retrospectives.
Once your log hygiene is solid, connect Struct to complete the loop. Automated first-pass investigation, Slack-native follow-up, and seamless GitHub handoff mean your engineers review conclusions instead of hunting for them.
Adjacent topics worth exploring next include distributed tracing with OpenTelemetry, AI-driven anomaly detection, and SLO-based alerting thresholds.
Book a demo to eliminate triage delays
Frequently Asked Questions
What minimum logging and tooling maturity does my team need before Struct adds value?
Your team needs at least one active alerting trigger such as a Slack channel, PagerDuty policy, or Linear ticket, a connected code repository such as GitHub, and at least one observability source such as Datadog, AWS CloudWatch, GCP Logs, or Sentry. You do not need perfect log hygiene on day one. Struct will surface what context exists, and the gaps it encounters will highlight exactly which of the eight practices to prioritize first. Teams with basic structured logging and trace IDs in place see the highest investigation accuracy immediately.
How long does Struct take to set up?
Setup takes under 10 minutes. You authenticate your alert source, connect your code repository, and link your observability platform. Once those three integrations are live, you enable auto-investigations on your chosen Slack channels or ticketing queues. Struct then begins investigating the next alert that fires automatically, with no extra configuration required to get the first result.
Our logs are inconsistent and poorly structured. Will Struct still work?
Struct performs best when logs are structured, trace IDs are propagated, and alerting is configured. If your system lacks basic logging or trace identifiers, the AI cannot reconstruct a complete timeline from code analysis alone. Struct will still attempt to correlate whatever signals are available and will indicate clearly where context is missing. That behavior acts as a practical audit of which logging gaps to close first. The eight practices in this article are the fastest path to maximizing Struct’s investigation accuracy.
Is Struct compliant with SOC 2 and HIPAA requirements?
Yes. Struct is fully SOC 2 and HIPAA compliant. Log data is accessed and processed ephemerally during an investigation and is not retained beyond the scope of that investigation. For the vast majority of Seed-to-Series-C companies in the U.S., this compliance posture covers standard contractual and regulatory requirements. If your organization requires full on-premise deployment with zero data leaving your VPC, contact the Struct team to discuss roadmap options.
Can junior engineers safely use Struct on call without deep system knowledge?
Yes. Struct acts as an automated senior engineer for the first pass of every investigation. It digests your team’s custom runbooks, correlation ID formats, and service topology, then provides a heavily contextualized starting point, including blast radius, root cause hypothesis, and suggested next steps, before the on-call engineer takes any action. This means a junior engineer on their first solo on-call shift has the same investigative starting point as a senior engineer with years of tribal knowledge. You can also encode your internal runbooks directly into Struct so the AI follows your exact operational procedures for each alert type.
